Category Archives: Flash

Updated ‘Elastic Racetrack’ for Flash 9 and AVM2

In 2005 Ted Patrick posted a great article on the frame execution model inside the Flash Player that he dubbed the ‘elastic racetrack‘. It’s served as a great reference for me over the years to help understand how code execution and rendering were balanced within the processing of a frame. Since the introduction of Flash Player 9 and the new AVM2, I’ve noticed a few changes to the elastic racetrack model and thought I’d share them. This information is based on research into Flash player internals as well as observations I’ve made playing around with the event and rendering model, but the full model hasn’t been confirmed by Adobe engineers.

The basic premise of the original elastic racetrack is still the same. Given a specific frame rate to operate on, the Flash player will devote the first segment of the frame to execute code, and the second segment to render display objects. Either segment can grow its part of the racetrack to accommodate more processing and effectively extend the duration of the frame.

Flash Player Elastic Racetrack

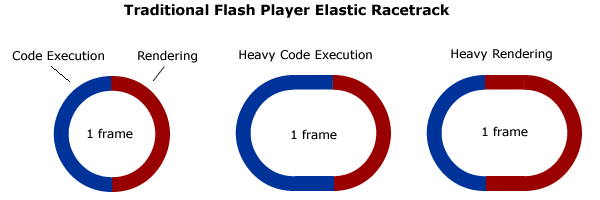
What changes from the previous model is how those segments look under a microscope and how they come together to form a ‘frame’.

AVM2 is controlled by what I’m going to call the Marshal. The Marshal is responsible for carving out time slices for the Flash Player to operate on. Its important to clarify up front that these time slices are not the same thing as the framerate compiled into a swf, but we’ll see below how the player ultimately synthesizes a framerate from these slices. Running a Flex compiled swf within Firefox under Mac OS X, the Marshal appears to be carving out 19-20 millisecond slices, but this can be different between platforms and browsers based on what I’ve observed as well as Adobe employees have hinted at. This can also change depending on how the swf was compiled, see some of the comments below. For the sake of the article lets assume we’re only talking about a 20 millisecond slice to make the math easy. This means the Marshal will attempt to generate and execute no more then 50 slices each second, and it may be less depending on the elasticity of code execution or rendering. Inside each slice, 5 possible steps are processed in the following order.

  1. Player events are dispatched – This includes events dispatched by the Timer, Mouse, ENTER_FRAMEs, URLLoader, etc…
  2. User code is executed – Any code listening to events dispatched by step 1 are executed at this stage.
  3. RENDER event is dispatched – This special event is dispatched when the user calls stage.invalidate() during normal user code operation.
  4. Final user code is executed – User code listening specifically for step 3 is executed at this point.
  5. Player renders changes to the display list.

AVM2 Marshalled Slice

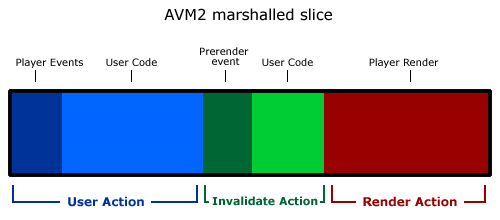
The Marshal executes this 20 millisecond slice over and over and decides on the fly which actions to run. The exact actions processed within a slice will ultimately derive the 2 main racetrack segments (code execution and rendering) that constitute a ‘frame’. User actions and Invalidation actions fill up the code segment track, while Render actions fill up the render segment track. Its important to note that actions will only occur at times predetermined by the Marshal, so a if you have a short running User action, the Marshal will still wait a few milliseconds before moving on to the Invalidate and Render actions.

The best way to illustrate which actions are run and how the elastic racetrack is created, is to look at how those slices are processed on a swf running at 5 fps, 25, fps, and 50 fps.

Flash Frame Marshaling Diagram

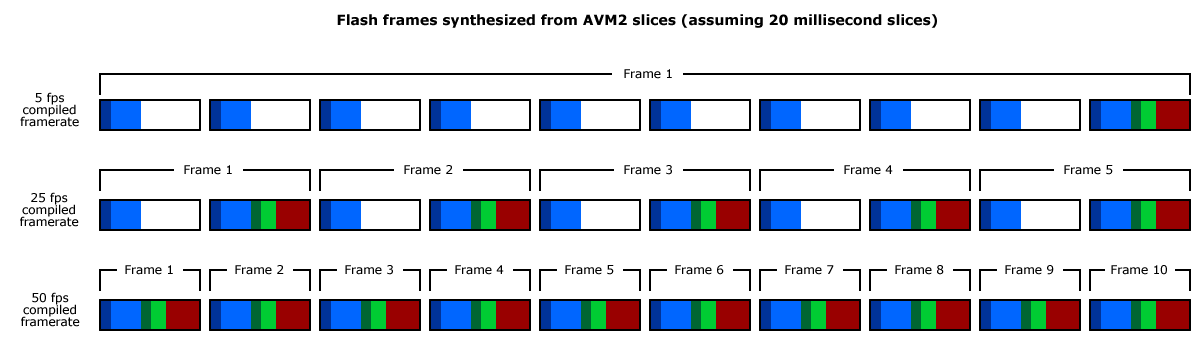
As you can see, the elastic racetrack performs different actions per frame and requires a different visual illustration depending on the framerate that the player is trying to synthesize. So for a swf running at 5 fps, each frame processed 10 User actions, 1 Invalidation action, and 1 Render action. At 25 fps, each frame processed 2 User actions, 1 Invalidation action, and 1 Render action. At 50 fps, each frame processed 1 User action, 1 Invalidation action, and 1 Render action. Whats important to note in the above chart is that some events are only available in certain slices. For instance, the Event.ENTER_FRAME event will only ever be dispatched in a slice that occurs at the start of a frame.

So what does this all mean? Theres a couple quick ideas to take away from this.

  1. Long running code execution or render segments can extend a given slice beyond 20 milliseconds. Elasticity will be applied to that particular slice and the duration of the frame may or may not be extended as a result. The Marshal may drop the number of slices that constitute a frame in order to keep the active framerate close to the compiled framerate.
  2. A swfs real framerate won’t exceed the Marshals rate defined for the player instance. You can set your compiled framerate at 120fps, but Flash will still only process 50 slices max that generate 50 render calls (more or less depending on the system config).
  3. Code can be executed more often then the compiled framerate. A swf compiled at 1 fps can execute a Timer or Mouse event in every slice, even though it will only render in the last slice. Additionally, if you choose, you can render to the screen sooner then the compiled framerate by calling updateAfterEvent() , but only within a Mouse, Timer, or Keyboard event handler. In this instance though, the Marshal will consider that the end of the frame and start a new frame on the next slice. Lastly, Flash will force an automatic render when mousing over any Sprite that has had its visual properties (x,y,width,height,etc..) changed, naturally this still occurs at the end of the slice and any prerender logic will still run.
  4. Compiling a framerate that isn’t a multiple of the total number of slices per second for your platform will cause irregular rendering as it tries to divide up the slices. If you were to compile in a framerate of 20 on a platform executing 50 slices per second, then the player has to render 2 frames every 5 slices and would follow a 3-2-3-2-3-2 slice-to-render rate.

These 4 facts are moving targets though, since for this article we’re working on a 20 millisecond slice that’s processed 50 times per second. In reality you’ll see time slices as low as 5 milliseconds or as high at 100 milliseconds and some of the math will change as a result.

If you’d like to test this model for yourself, the easiest route is to create a swf running at 1 fps and another at 100 fps both with a Timer object set on a 1 millisecond interval. Inside the Timer event handler change the x property of a display object and hook a bunch of getTimer() traces up to different player events like Mouse, EnterFrame, and Render and watch the carnage unfold in your console. The rest of the information you can’t derive from the results comes from alot of context about the player I’ve learned over the past 2 years and so isn’t as easily visible. If anyone has any information to help add to or correct the above model, please submit it in the comments.

Thanks to several readers who have clarified some of the differences between Flex and Flash as well as how the Flash API is able to change the default behaviors described above.

Why Bubblemark is a poor ui benchmark

A few months ago someone on the Adobe boards asked why the Flex testcase in Bubblemark seemed to act so different in AIR versus in the browser. Yesterday, I saw the same question come up again and I figured I’d finally weigh in on the topic. The simple answer is that the test was created improperly, the complex answer has to do with the inherent limitations of the test itself.

First off, for those who don’t know what the Bubblemark test is, its a simple animation test case implemented in different GUI frameworks, its kinda like an Acid2 test for rendering speed. The charts should ideally give you a base number to understand how well one technology compares against another for rendering. As a GUI developer I’ve been a bit underwhelmed with the whole thing and heres why:

  1. The author doesn’t understand Flash’s rendering engine. The easiest way to illustrate how incorrectly the Flash test was designed, is to download the source and change the compiled framerate to 1 fps. Re-compile and run the test and you’ll notice the benchmark framerate running at ~50 fps. You can clearly see the balls only moving once per second, yet the test thinks its flying along. This is because the testcase makes the incorrect assumptions that changing the properties of a DisplayObject causes it to render right away. The reality is, Flash holds on to all display updates till the next render pass and applies all the latest changes at once. Changing the position of an object every 5 milliseconds is meaningless when Flash is bound by a 33 millisecond render pass (or whatever you’re framerate divided by 1000 happens to be). A correct test case would rely on an ENTER_FRAME handler to change x and y values and get rid of any Timer calls.
  2. Framerate tests above 60 fps are meaningless. Seriously, any GUI benchmark designed to test above 60 fps is bogus. In fact, a pretty simple optimization technique for Adobe or Sun would be to cap the paint requests that get forwarded to OS X or Windows, simply because the majority of computer users these days are on LCD panels which natively run at 60 fps. Some operating systems even go a step further and limit the effective framerate of paint requests it sends to the videocard (see Beam Sync on Mac). So when you see the Java test case fly up to 120 fps on Bubblemark, you can realistically only see 60 of those frames, and there might be a chance the other 60 are never even calculated by Javas layout engine.
  3. The test just moves balls around! This is my biggest beef with the benchmark because it only tests one simple aspect of the rendering engine in these technologies, which is bitmap translation. How do bitmaps moving around the screen tell you anything about the capabilities of the respective technologies? Do the JavaFX guys really think optimizing this usecase will make their technology relevant? The only thing Bubblemark will tell you is which runtimes might best handle bitmap particle emitters….thats about it. Theres a lot more that goes into both the layout engine and the rendering pipeline of these different technologies and its a shame that only the most basic aspect is being tested. The funny thing is, if you open up your task manager while running the tests, you’ll notice that several of them don’t even try to run at full speed, my CPU is sitting as low as 20% in some cases. This means the runtimes don’t even consider the test difficult enough to give it full attention and have opted for using less power over faster motion.

I don’t mean to cut down the developers responsible for Bubblemark because at least they came up with a simple way to help us all compare these different technologies, I just think its a bit misguided to put any meaning behind these numbers. When evaluating your options for a GUI framework in our flashy web 2.0 world, you need to consider how well a technology can handle object scaling, alpha transparencies, rotations, text reflow, along with basic x and y translation and dynamic redraws. Even more realistically, developers need to be aware of the limits in the 25-45 framerate region since this is where you can efficiently balance render complexity with smooth animation. I’ve uploaded a couple quick test cases in Flash, HTML, and Silverlight that I think provide a good foundation for stressing a rendering engine and hopefully I’ll get a chance to expand them more into a full test suite.

Kick starting the garbage collector in Actionscript 3 with AIR

During the final months of my work with eBay Desktop, my sights were set squarely on optimization, both memory and cpu. When it came time to start messing with the garbage collector, my sanity went from bad to worse. What I originally thought was going to be a straightforward way of releasing memory in AIR turned into a 2 month long testcase with some discouraging outcomes.

Memory usage in eBay Desktop was something that always lingered in the back of my mind during the entire development cycle. Because of the shifting nature of our requirements, the issue was only explored near the end, even though we knew in the beginning that memory usage had to go through valleys and peaks in a managed way while users spent time in it throughout the day. We had alerts that would open and close, we had an app that would run in the system tray, and we considered making a ‘lite’ mode that would sit on top of your desktop all day, each of which had different memory requirements. In the beginning we used a well known hack to test garbage collection until part way through the development of AIR and Flex 3 Adobe finally added support for calling the garbage collector directly. We knew at this point we had a viable route for managing memory since Adobe was now making the effort to acknowledge the need. So now all that was required was a simple call to

flash.system.System.gc()

and we were set to go….right?

Well, not exactly. First off we learned that a call to System.gc() only does a mark OR a sweep on any given object, but not both in the same call. So in order to have the effect of releasing memory back to the OS, we needed to call it twice in a row. One call to mark any dereferenced objects and sweep away old marks, and the second to now sweep away marks from the first call.

flash.system.System.gc();

Now this seemed to be releasing memory back with pretty basic test cases, but it wasn’t working under production scenarios and we had to turn to Adobe engineers to help with the problem. What we learned was that you have to contend with 2 different kinds of pointers when working in AS3; pointers that exist in bytecode, and pointers that *may* exist in the Flash player itself that you’d never know about. What I started to realize was that the Flash player was never really engineered to be aggressive about memory usage. It was designed to plug memory leaks and manage memory plateaus, but not designed with an assumption that users would be interested in lowering those plateaus. It makes sense because most Flash content is viewed in the browser for a short amount of time before the plugin is destroyed and all memory is released when a user navigates away. With AIR, the rules changed since users are more conscience of discreet application memory usage and applications might not always need the same memory when launched vs after 2 hours of usage.

First up we found that the Flash player was always maintaining a reference to the last Sprite clicked, so if you destroyed an AIR window that the users had interacted with, you couldn’t get garbage collection to work until interacting with another window, which can become a big problem if you’re running in system tray mode and there are no windows to click in. Secondly we learned that you have to push any existing enterframe handler off the call stack by creating a new one. Adobe took care of the first problem, but to handle the second one we had to change our GC call a bit.

private var gcCount:int;
private function startGCCycle():void{
	gcCount = 0;
	addEventListener(Event.ENTER_FRAME, doGC);
}
private function doGC(evt:Event):void{
	flash.system.System.gc();
	if(++gcCount > 1){
		removeEventListener(Event.ENTER_FRAME, doGC);
	}
}

Another facet we hadn’t considered was the affects of the Flex framework on garbage collection. Flex kept some of the same design philosophy as the player itself, mainly that end users were loading applications in the browser and then navigating away when done. Garbage collection was therefore considered on a micro level involving user components, but not at the framework level which could be guaranteed to exist throughout the life of the app. Adobe made strides on patching the framework to work better in discreet Windows, but ultimately some things couldn’t be changed. What we found was that CSS could not be defined in any <mx:Window> component. It had to be defined in the root <mx:WindowedApplication> which would take care of declaring CSS globally for all windows. Also we were forced to clear some global variables ourselves, which caused our code to now look like this.

private var gcCount:int;
private function startGCCycle():void{
	ContainerGlobals.focusedContainer = this;
	gcCount = 0;
	addEventListener(Event.ENTER_FRAME, doGC);
}
private function doGC(evt:Event):void{
	flash.system.System.gc();
	if(++gcCount > 1){
		removeEventListener(Event.ENTER_FRAME, doGC);
	}
}

Lastly, not all features in AIR could be unhooked with our enterFrame trick, after another couple days of testing we found components that needed to be unhooked with Timers like the HTML component. One last tweak to our garbage collection cycle and we were home free.

private var gcCount:int;
private function startGCCycle():void{
	gcCount = 0;
	addEventListener(Event.ENTER_FRAME, doGC);
}
private function doGC(evt:Event):void{
	flash.system.System.gc();
	if(++gcCount > 1){
		removeEventListener(Event.ENTER_FRAME, doGC);
		setTimeout(lastGC, 40);
	}
}
private function lastGC():void{
	flash.system.System.gc();
}

We were now able to successfully garbage collect any objects that have been dereferenced in Flash. We had three things we had to look out for in the app now.

  1. All display objects that added listeners on to model data had to be weakly referenced or they wouldn’t be automatically dereferenced. This is because our architecture kept model data alive while individual window stages were being destroyed. I feel like I should point out that contrary to some beliefs, it is not a good idea to apply weak references by default throughout your entire app. Trust me when I say that its alot easier to debug an application with memory leaks due to strong listeners, then it is to debug an app in which users report random failures because underneath the hood weakly referenced objects are getting accidentally destroyed when the GC kicks in. You can never avoid bugs, so you should program in a way that makes them consistent to find.
  2. All asynchronous events needed to be explicitly shut down. This included Timers, Loaders, File and DB transactions. Setting these to be weakly referenced is not enough as all asyncronous objects in AS3 register themselves to the Flash player while they are running. It is impossible to access objects that have been dereferenced in code but continue to be referenced by the player like a running timer.
  3. No anonymous closures allowed.

After all this was taken care of we began to learn that garbage collecting objects in Flash didn’t translate so easily to releasing memory back to the OS. If you ever look at the memory graph in the Flex debugger and then open up the Task Manger or Activity Monitor to compare memory usage, you’ll notice a huge disparity between the two.

Flex Builder memory profiler
FlexBuilder reports only 15mb of AS3 object data

AIR system memory profile
AIR private memory really takes up 65mb on the system

The difference you’re seeing is Object Memory vs. Rendering Memory and the bulk of all memory used by the Flash player goes toward rendering. Displaying an empty stage in Flash can take up anywhere between 10mb and 20mb depending on the width and height and then it climbs by roughly 4k for each display object attached to the stage. This can add up quickly when using the Flex framework where even a simple button uses several display objects.

What we ultimately found was that even though we could successfully release AS3 objects, we couldn’t reliably get the Flash player to release render data. So an app that started at 20mb would climb to 100mb, and when the entire stage was destroyed, we’d go back down to only 80mb. You can actually test this for yourself by downloading a sample Flex 3 project and observing the effects. What I’ve learned from Adobe is that the player ends up fragmenting memory quite a bit. It probably goes back to the heart of the initial design of the Flash player I described above. All the effort was put into making a killer GUI environment that deferred memory management to whether the browser window was open or not, and as a result the memory system was not optimized for more aggressive use cases. I can only guess the problem comes from the fact that AS3 code is attached to the timeline of the player itself, and managed by the elastic racetrack. As a result both AS3 objects and render data get mixed in to the same memory page, and releasing just the render data doesn’t matter when model data is placed on the same page.

Adobe has assured me they are working on the problem but it realistically won’t make it in until after AIR 2.0, and its unclear whether those fixes will be merged into the the plugin player given that the need isn’t very high for web pages. Until then, you can not count on creating an application in AIR that releases memory back to the OS. The best approach is to reuse the smallest amount of displayobjects possible to achieve the desired workflow. Get used to adding and removing children without destroying them but instead sliding them off into a pool for later reuse, as this helps keep the memory plateau low during use.